Saturday Summary December 1, 2012 13 years ago
December 1, 2012
Joe Bastardi
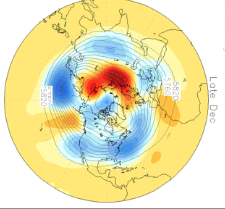
In spite of the warm start, the WeatherBell December and winter forecast is cautiously cold over the winter with the threat of a major stormy cold pattern evolving mid-December to mid-January for much of the nation but focused from the plains eastward. The theory is the step-down descent of temperaturess from the July heat (we are talking against normals) and can be seen clearly in Dr Maue's chart:

It is related to the seasonal intensification of the jet and the adjustment that the atmosphere makes to each cold shot. However, as the jet strengthens to its full capacity, the pattern locks into cold. Over Europe and the far east, the long standing ideas we have had (we have clients in Europe and have had European December painted like 2010 since spring) have occurred. Very often, things happen there first before the states. We are the smaller land mass with a big ocean to the west and smaller to the east, and that makes a difference. Last year, Europe and Asia got cold mid to late winter and by the time the feedback of the pattern brought a trough to the US, it was too late (February). But for those that don't get the premium site (I wish you would, 50 cents a day, cheaper than suits I like to buy, haha) I have been stressing that the feedback GOING INTO THE WINTER, with the pre-existing conditions, is very different from winter coming out. What can lead to a heat wave in March can mean a cold spell in December. In fact, when we look at the Madden Julian Oscillation (MJO), the very phases that lead to warmth over the east and plains and enhanced tropical activity in October are the COLDEST IN THE MIDDLE OF WINTER! That is actually a theory I have been using over the years with some degree of success -- that if the Atlantic ACE intensity in October is stronger than the SE Pacific, look for a cold first half of the winter. Let's see if that is the case this year, certainly the modeling is going right to it.
The JMA evolution yesterday over the next 4 weeks showed a deep trough developing over the east in days 16-29.
Today thru Friday: Next Saturday through following Friday:
.png)
.png)
Days 16-29:
.png)
That is a heck of a pattern. Notice, if you will, that blue colors have taken over SE of Hawaii rather than the yellow now . This is called the Eastern Pacific Oscillation and the reversal there is favorable for a major trough over the eastern US. The model above is cold and stormy with arctic air being delivered into the US and southern storm track.. If you are rooting for winter for the Holidays, this is what you root for. This of course is a problem for travelers.
It is something I am jumping on because it is in line with our ideas . The December forecast in spite of a very warm start looks like this:
(2).jpg)
The winter looks like this, very similar. For in spite of what I do think will be break later in January into part of February, the 30 days December 15-January 14 may put the forecast away for the cold. The old adage "what happens in December the winter will remember" could come back into play in the latter part of the winter.
.jpg)
The JMA yesterday was preceded by the Korean model going strongly to the late December trough, and then for early January, a pattern that looked a lot like the pattern that set up the major cold for all the US in late December 1967 into early January 1968 (the year of the famed Ice Bowl between Green Bay and Dallas...).
KMA mid December KMA late December

KMA early January

Notice the ridging in Europe, like 2010, breaking the severe cold, but it is over North America that it is coldest then resides.
In any case, this morning, the ensemble packages of the European, Canadian and US all went to the perceived ideas we have which the other modeling above was showing:
.png)
Again, notice the change in the Pacific pattern from what we see now and all the blocking!
We interrupt this Saturday Summary for a special rebuttal to the Senators on capitol hill saying Sandy is a climate change feature.
I offer up this, from left to right. Hurricane hits when CO2 was lower, CO2 vs global temps. The blue is the ocean temp, which seems to be correlated almost perfectly even as the measure of plant food (co2) is going off on its merry way and to the right, MAJOR hurricane hits 1954-1960 on the east coast, far in excess of what we have had even in this cycle. The bottom line is that the natural cycle, which is like the 1950s, would argue that Irene and Sandy are warmups for what we will have to deal with in the coming 5 years during the warm AMO, which I have been yapping about for several years, and Dr. Bill Gray at Colorado State said was coming since the 1970s! (he also says after 2020, we calm back down with Atlantic production, which I agree with whole heartedly.

Now here is a question any objective person of goodwill and with an open mind should ask. Have people that are pushing all this actually looked at such things? You would never hear me arguing that CO2 CAUSES LESS HURRICANE HITS, yet I could, right? What we do know is that global temperatures are much more correlated to the oceans, and that in a similar period in the natural climate cycle (cold PDO, warm AMO) hurricanes roamed the east coast like it was their job.
Now back to our regularly scheduled program...
The coming week features out of season warmth in the plains
.png)
but the chopping starts later in the week:
.png)
and a reversal in days 10-15:
.png)
turns into back points and a possible pin days 15-25:

25-35

before starting a fade, but still cold days 35-45:
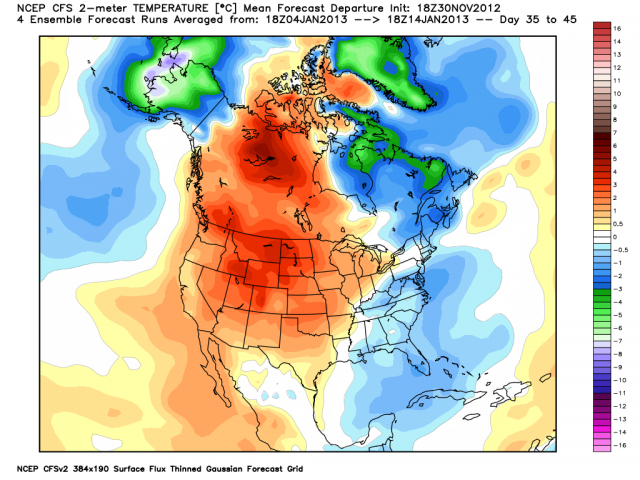
This now agrees with our idea that a significant, perhaps severe period winter weather evolves, with the west involved for a time but centering further east later in the month. Where I am having problems is where this US model goes days 35-45 (the last one) as I believe more the Korean for widespread cold then, trying to pull back west a bit, but I will fall through that ice when I come to it (a winter version of jump off that bridge).
Here is the Christmas week snowcover forecast by the US-generated CFSv2:

Neat, eh? Check this out for the week leading up to the inauguration.... one member has close to 2 feet of snow on the ground in DC:

Something tells me if that happened, the climate change part of the speech might be scrubbed (just having some fun okay).
In the coming week, as far as precipitation goes, the heavy rains are pulling north further in the west and a strong trough mid and late week will help pump amounts over the lower Mississippi valley into lakes. The ECMWF has a day 10 snowstorm in the northeast, but I can handle that next week, I don't want to rush this.
Precipitation:
.png)
The week after should be more generous further west in Texas, and it may snow into Texas during week two.
Snow this week, the northeast snow is what is going through now
.png)
Not very much.
For our Euro friends, again the idea this was going to be like December 2010 has merit!
Upcoming 16 days:
.png)
Europe same period 2010:

Europe snow the upcoming week (notice model trying to make it snow into Africa. Will they know its Christmas in Africa? In the north, they will at least suspect it with all the cold, and if it snows)
.png)
Because this is seen for everyone, some things are referenced here that were explained in our posts on WeatherBELL Premium. We try to show people the why before the what.. so when I said, this idea and that idea are coming our way, that is why you read that. I also have my subscribers reading this, but I don't take off ideas that are wrong. We don't pull down posts. I look at everything as a test, competition if you will, and I do try to go over what went wrong for the readers, and it usually helps me for something else. For instance I steadfastly held to the idea Sandy would re-deepen in its leg north of 30 north. Part of what helped me was a) the preseason idea of watching for in-close intensification but b) the fact the difference between my ACE forecast and reality was not the correctly forecasted idea in the deep tropics, but the intensification of more storms than I thought north of 30 north in the central Atlantic. This lead me to conclude that the atmosphere was ripe for not only the heat Sandy carried north out of the tropics, but she was getting a fresh input from the overall pattern and warmth in the western Atlantic, BUT THE INFLOW FROM THE EAST AND SOUTHEAST THAT WAS OBVIOUSLY WARMER THAN NORMAL. So errors lead to corrections and corrections lead to the pursuit of perfection, which of course as men we can never have, but it is worth trying. Recall that in Sandy, our Wednesday and Thursday idea called for intensification along with the landfall. Other sources were weaker and out to sea. I do not want to get into their ideas, but instead give an example of what may be a bit different at Weatherbell.com. I don't try to run from mistakes, but use them if I make them. In any case, the computer models that Dr, Maue is developing are worth the price anyway. It's a tough economy, but we value everyone that comes to us.
Its all about the weather, the weather never stops, and as much as humanly possible, neither does our team
After all, you should enjoy the weather, it's the only weather you got
Ciao for now