2025 Hurricane Season Forecast Update 1 day ago
April 7, 2025
- The 2025 Hurricane Season should have fewer impacts than 2024, but they will still be above normal.
- We are expecting an eastward and northward shift of the core of impacts compared to last year.
- Changes in the Atlantic Basin are much more important than any weak ENSO signal.
- There are no changes to the numbers from the first forecast.
- There is excellent support from the Euro.
- Other forecasters have followed our lead, indicating there is some independent consensus on numbers.
- The total number is not as important as the impacts.
- The Power and Impact scale is a far better indicator of overall storm strength and likely extent of damage.
- The wild card is sudden warming off the Pacific coast of northern South America (ENSO region 1+2).
Forecast according to the Power & Impact Scale
Named Storms: 15-19
Category 1 or greater hurricanes: 7-9
Category 2.5 or greater (major in the Power & Impact Scale): 3
Saffir-Simpson Hurricane Wind Scale Forecast
Named Storms: 15-19
Total Hurricanes: 7-9
Major Hurricanes: 2-3
ACE Index: 120-150
Impact Forecast
Tropical Storm Conditions: 5-7
Total Hurricanes: 3-4
Major Hurricanes: 1-2
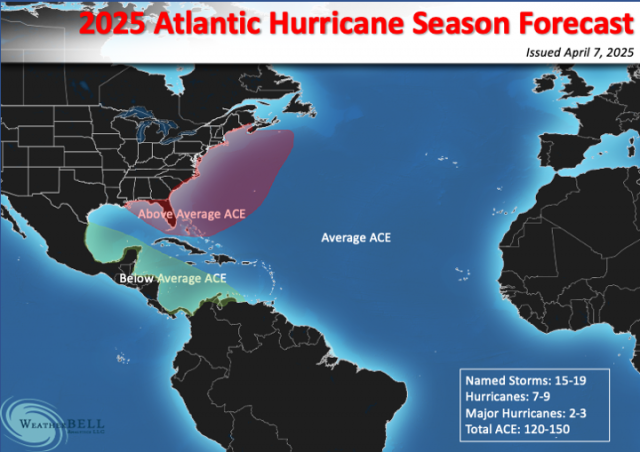
The main purpose of this update is to add the above- and below-average areas and to draw a contrast with last season. In short, we don't expect it to be as bad as last season, but we still expect above-normal impacts on the U.S. coast. The core area of impacts is liable to be to the northeast of last year's.
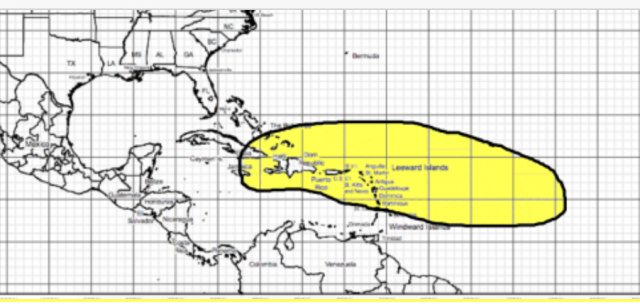
We are now homing in the impact area (red zone) and also a below-normal area (green zone) like in 2019. Amazingly, that year saw Dorian, the beast actually waited to explode until out of the zone we forecasted:
Hurricane Dorian's path:
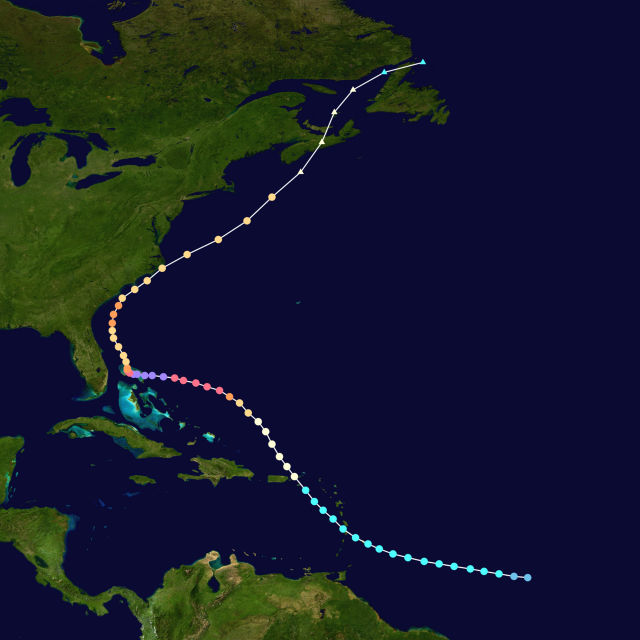
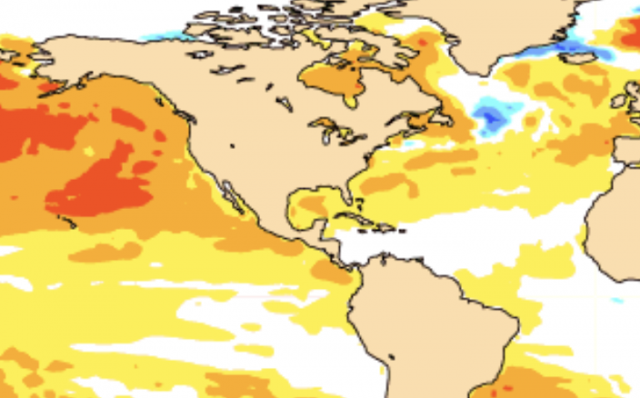
That was classic, exploding after the bend back to the west. Like all the majors more than two days away, it hit off its peak when it reached the U.S. The below-average area this year is where Beryl was near its strongest last year. As a side note, SSTs are quite close to that 2019 analog.
This year's SSTs:
2019's SSTs:
The totals for the 2019 season:
Commentary
A word about our forecast: I believe the whole total number game is a red herring. Since 2011, we have pioneered forecasting above- and below-average regions for ACE, the so-called red and green zones. I am noticing that other forecast entities have followed our issuance on February 7 with similar total numbers, and I applaud attempts at also doing what we have been doing - forecasting where action will be the greatest.
I suspect that in the coming years, the National Hurricane Center will forecast areas of above-average activity as well, and they will come up with something along the lines of our Power & Impact Scale to replace the outdated Saffir-Simpson scale. A spot wind at one point does not do justice to the entire hurricane and also means storms that are much smaller in extent can be put in the same category as storms that are much larger. The use of the Saffir-Simpson scale in a climate forecast and history context also demands further rehaul and reanalysis. Even the National Hurricane Center admits that size matters, but their reliance on a single reading for the Saffir-Simpson scale belies that notion.
It would also be smart for the Atlantic Basin to be divided into two separate areas so the total numbers game can be more realistic. A suggestion would be that all storms that develop to the north of 35°N and to the east of 60°W be in a different category unless they turn back into the traditional areas that we have known about for over a century.
There will never be a better impact forecast than the one issued for last year on December 7, 2023:
.png)
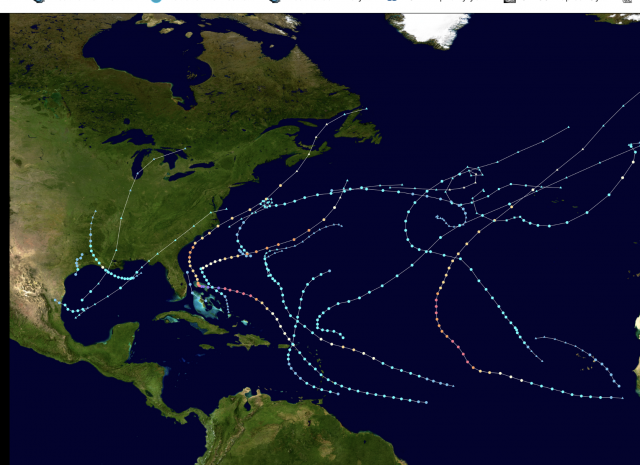
I have been doing a lot of research on these Gulf-centric seasons, like last year. Three Gulf-centric seasons stick out in particular because they came off of El Niños. I am using the seasons following these Gulf-centric seasons as analogs.
The first Gulf-centric season is 1995. Notice two congregations of tracks: a weaker one over the Gulf and the one out at sea.
.png)
The following year, 1996, saw the greatest activity between the two. This is one of our analogs.
.png)
The second Gulf-centric season is 1998, which had one main track at sea, and the other closer in. The centering of this season was Brownsville to Cape Hatteras.
.png)
The following year, 1999, despite having a batch out at sea, had a cluster near the Southeast coast. This is another analog.
.png)
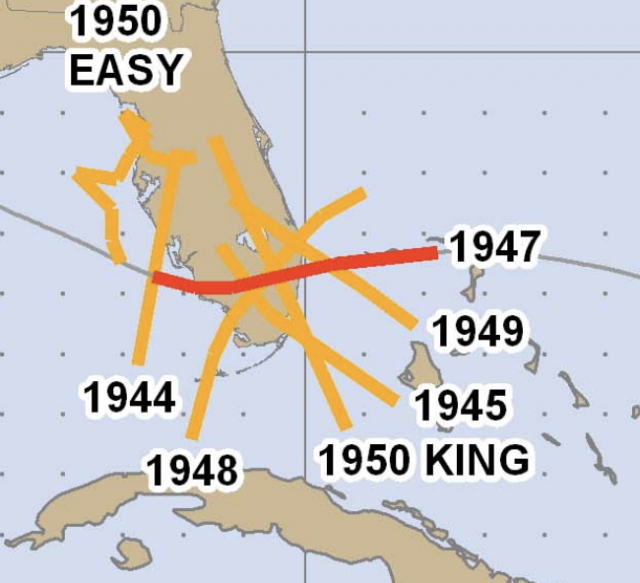
While much has been made, and rightly so, about how perilous the western coast of the Florida Peninsula has become over the past several years, just as astounding has been the lack of a landfalling major hurricane on Long Island or in New England since 1991. There has also not been a direct major hurricane hit in Florida between Key Largo and West Palm Beach since Andrew in 1992. The shift to the north of the main region of genesis and overall lower pressures across the global basins (including the Atlantic Basin) may have something to do with this. A storm developing to the north of 25°N and to the west of 80°W has the Gulf Coast to hit, as most of these storms have been deepening while moving more northward than westward (or in the case of Milton, eastward). This is because of the MJO phase and the fact that convergence naturally increases in the coastal waters if a hurricane is moving perpendicular to the coast rather than parallel to it.
In any case, longer-tracked storms have all hit the U.S. at less than peak intensity, while the more compact storms have made landfall while deepening rapidly. The size of storms has been trending much smaller. Helene was an exception to this trend. The question is when will southeastern Florida see a return to this active pattern?
In some ways, what is going on for the western coast of Florida is their version of what went on in the 1940s on the southeastern coast. Meanwhile despite seeing Category 4 hurricanes near the Bahamas in recent years (such as Floyd and Irene) none have made it to New England as hurricanes. The area of highest ACE relative to average is to the north of the Caribbean, which ups the ante for New England, as all hurricanes that hit New England from 1938 to 1991 either developed north of Caribbean or passed through there. Carol, Belle, and Bob were all late bloomers.
Comparisons to Last Year at This Time
The SSTs are vastly different. The warmth of the Atlantic means the ENSO events have little effect on the total numbers (as we saw two years ago). To some extent, a warm event does protect much of the U.S. Gulf coast, as the 2023 season was all out to sea. I issued that December forecast for 2024, anticipating that the Euro would trend in the direction that it did.
The Euro's SST forecast last year was a classic one. In retrospect, the warmth made sure the energy was in the tropics for the origins and not all over the place for the "ham sandwich" storms that get named in the middle of nowhere. We had next to none of those last year, and I had counted on several to form and increase season-total numbers. I had five more than the base number because of those expectations, but that numbers game is a red herring and an attempt to avoid real forecasting, which is taking a shot at where they will go. The idea that bigger numbers mean bigger impacts does not always work. Just look at 2010.
Last year's SST forecast:
.png)
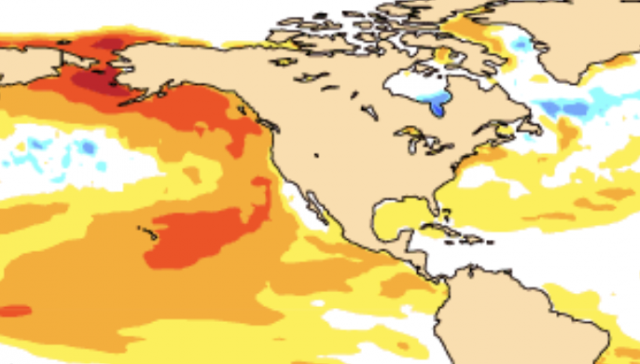
This year's SST forecast:
This year's forecast has a much cooler Atlantic Basin, and the warm water is shown to the north, which is a distorted energy signal. However, with more warm water in the North Pacific and closer to the coast, it would lead to troughs wanting to spin down into the Tennessee Valley and pick up features in the southwestern part of the North Atlantic Basin. Still, it's a very different look.
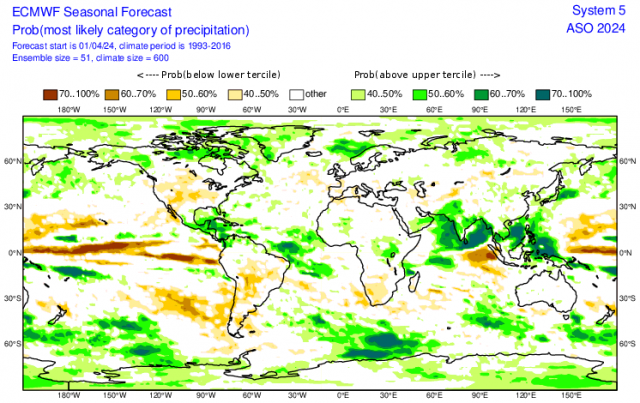
The Euro's precipitation forecast is almost 180 degrees opposite of last year. Note the heavy rain in the central and northern Indian Ocean, indicating the active African wave train we saw last year. Of course, we see all the heavy rainfall where the high impacts were, which validated our forecast that was released 5 months beforehand.
Last year's precipitation forecast:
This year's precipitation forecast is drier:
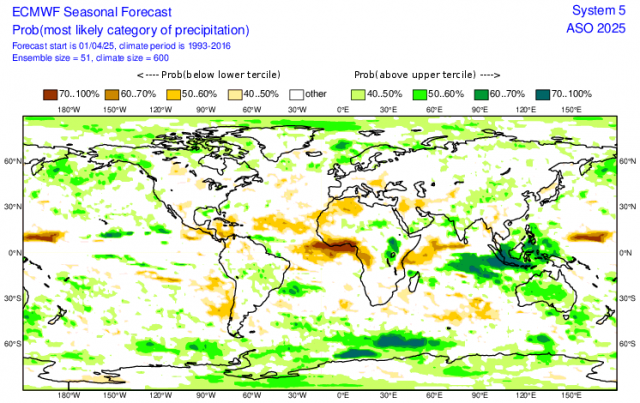
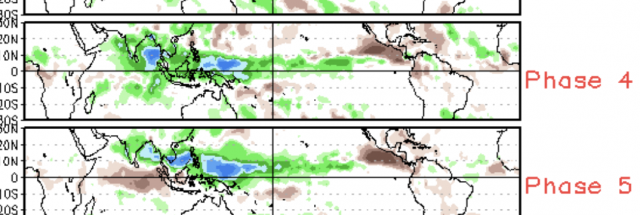
Notice the enhancement close in to the Southeast Coast. That is a bit more like a Phase 4 and 5 MJO pattern over the Indian Ocean, which is not as bullish as last year's.
I should note that we really caught a break last year when the MJO went into the non-favored phases for a time at the height of the season. If you had been reading along in August, we caught that and knew there would be a furious endgame to the season.
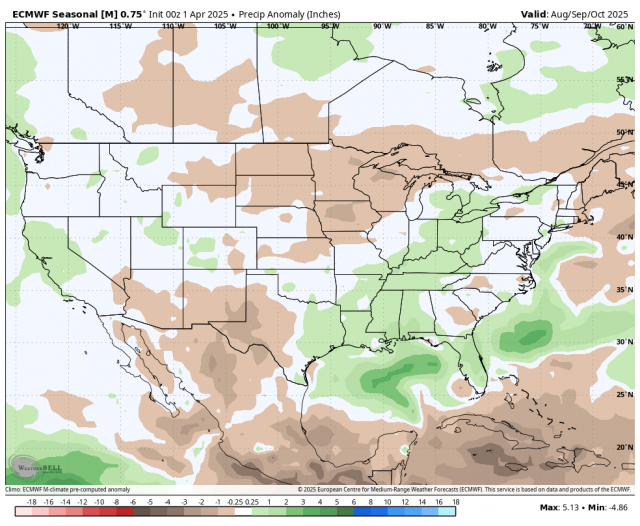
The precipitation forecast zoomed into North America shows that we do not have the Gulf below normal. In fact, it's above normal to the east. Meanwhile, the Caribbean is below normal.
Last year's SLP forecast was neutral across much of the basin:
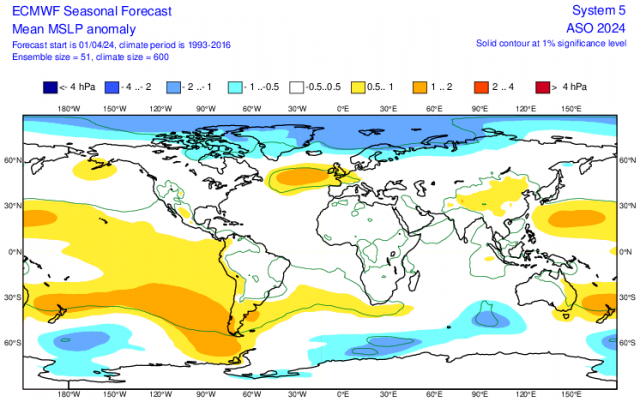
This year's SLP forecast is above average, but crucially highest in the North Atlantic:

This is one of those seasons when the Power & Impact scale will describe a storm better, as they may be higher on the Saffir-Simpson scale due to its one-dimensional aspect (maximum one-minute sustained wind speed). Ours has several metrics of wind speed, wind radii, pressure, and pressure tendency.
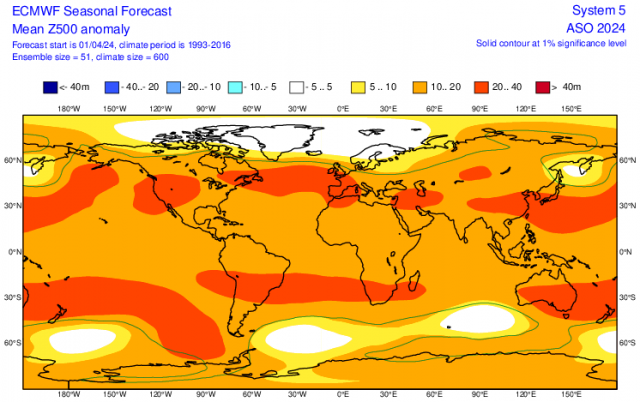
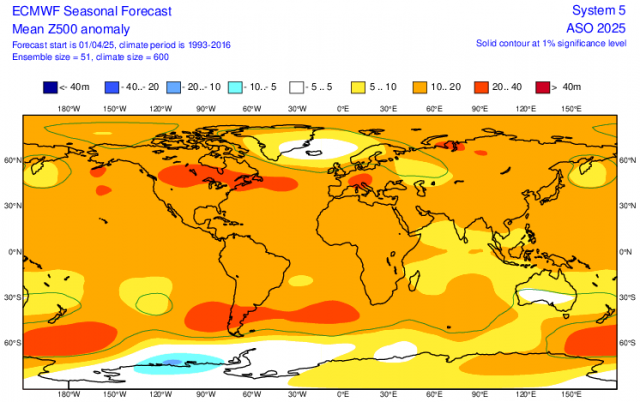
The 500mb forecast places a ridge from west to east to the north of 40°N, which leaves the U.S. coast open.
Last year's 500mb forecast:
This year's 500mb forecast:
I am not concerned about the ENSO. Last year's La Niña was overforecasted, but it was still a hurricane season from hell. This year, the impacts are not expected to be as great, but I still think an above-average season is on tap.
A comment on sudden warming in the Nino 1+2 area is necessary. All this is fine and dandy, but basing a forecast on a forecast, especially in the age of sudden warming events, is tricky. Nino 1+2 is the area off the Pacific coast of northwest South America. When it's warm there, it means the Columbian heat low is stronger, which enhances low-level easterlies in the Caribbean and increases shear. As of February, the models had no idea what was actually going to happen in April.
This was the SST forecast from February for April:
.png)
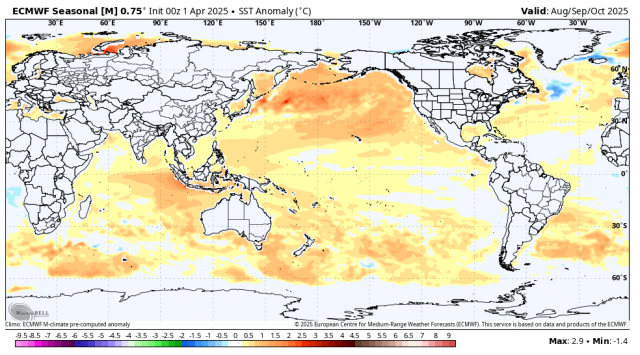
Instead, we see this:
.png)
It appears to be linked to a sudden increase in underwater volcanic activity in this area, which models cannot see until it's too late (and we don't get reports on this until it's too late):
.png)
This rapid warming is a wild card and could impact the forecast going forward, so it is something we will have to watch closely.
The Verdict
There is no change in the overall numbers here. There is no question that what we saw in December 2023 stood out so much that from that far out, we nailed the hurricane season from hell (the second costliest on record). I was overdone on the numbers game, though. With a less impressive look this year, I am expecting there to be fewer true tropical cyclones, but there is going to be a better chance for the "ham sandwiches" in the North Atlantic to pump up numbers.
This season will be a year where in-close development is a concern, as it has been recently, due to the distortion of overall feedback patterns likely brought about by the distortion of warming, the Global Wind Oscillation, and sea-level pressure patterns.
An active season is anticipated, but not as bad as last year. Remember, 2020 was very bad, and 2021 was not as bad but still stronger than average. Perhaps that is an interesting analog, too.